Karl
Hartig
charts, diagrams,
data visualization
charts, diagrams,
data visualization
|
Karl
Hartig
charts, diagrams, data visualization |
|
 |
|
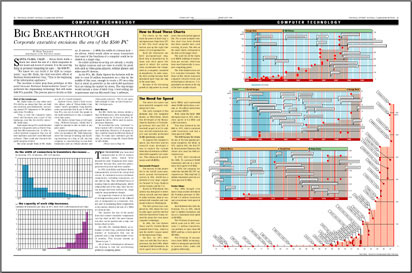
Computer Power
The charts on the right track the power of Intel Corp.'s microprocessor chips from 1971 to 1997. The chart along the bottom and up the right side shows a 27-year perspective. The scale for all the charts is in MIPS (millions of instructions per second), which has been used historically to measure computing power. |